Solutions
Compare Solutions
From the Solutions screen, a user can compare multiple solutions for the same scenario by clicking on the tick box, and then clicking on the [ Compare Selected Solutions ] button.
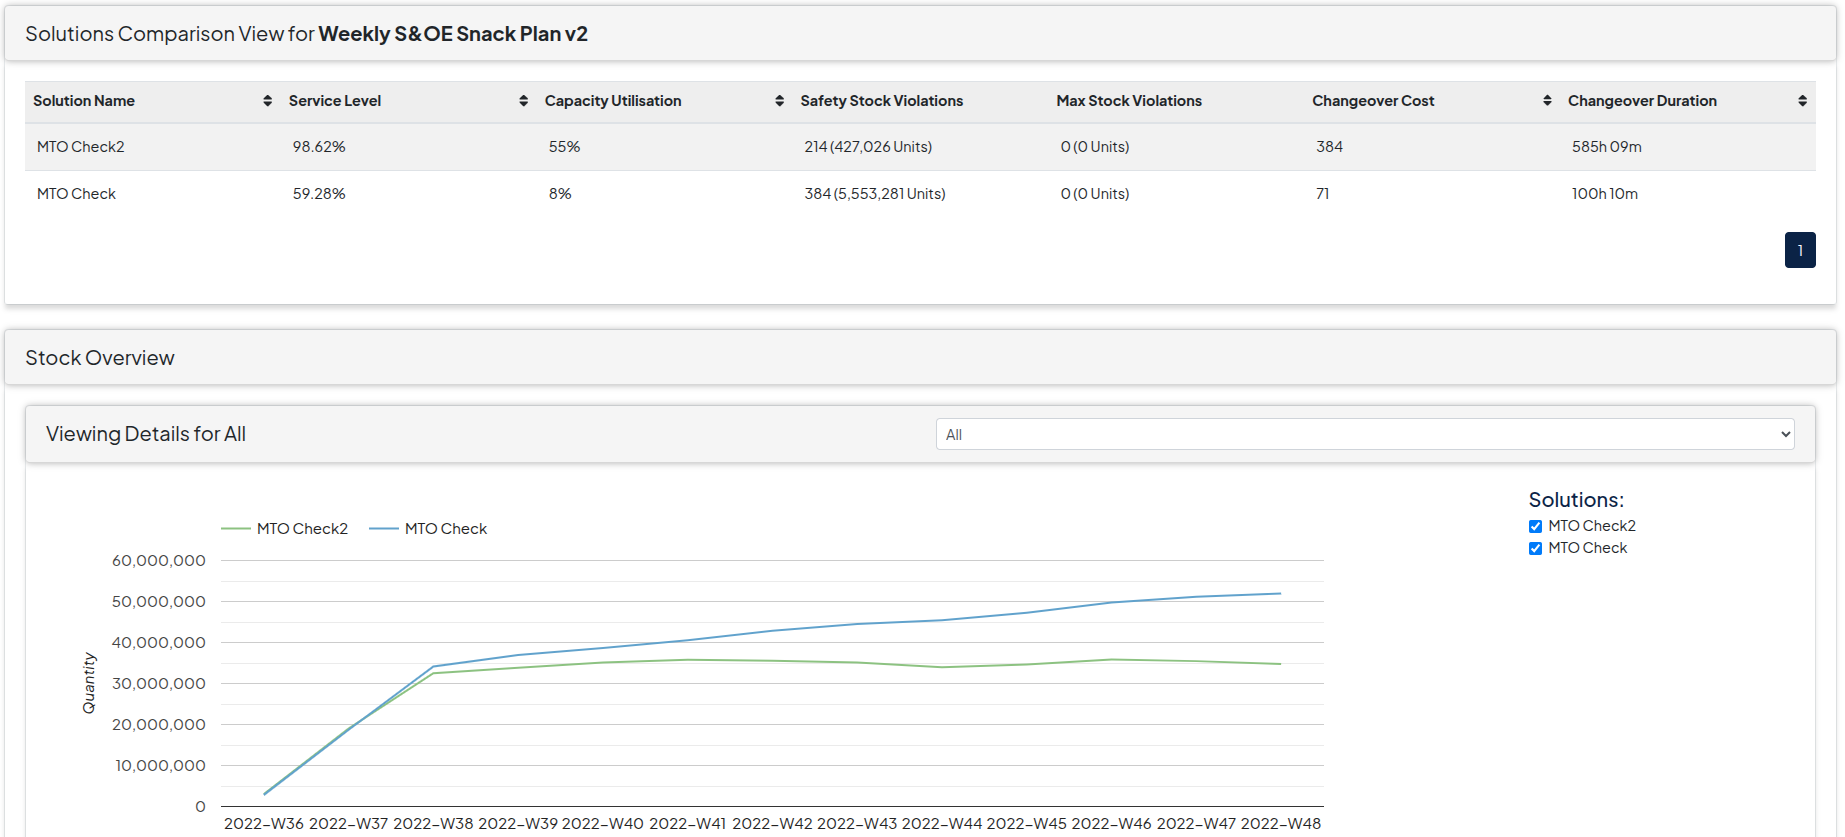
On this screen the following visual outputs can be analysed to compare solutions:
- Stock Overview (Filtered by Product Group) - To compare the stock levels of the solutions over the time periods. By Clicking on the tick boxes, solutions can be added or removed
- Line Utilisation (Filtered by Line) - To compare the capacity utilisation of the solutions over the time periods. By Clicking on the tick boxes, solutions can be added or removed
- Service Level - To compare solutions where production levels have not met the demand forecast levels
- Stock Violations (Filtered by Product Group, and Max / Safety Stock) - To compare the amount of the stock violations for each solution
- Changeover Duration (Filtered by Line) - To compare the changeover costs implied on each solution