Solutions
View Solution
From the Solutions screen click on the Solution button. This will open the Solution screen for the individual solution that has been completed.
On this screen the following visual outputs can be analysed by line and product group. By clicking on the following tabs, different outputs can be seen:

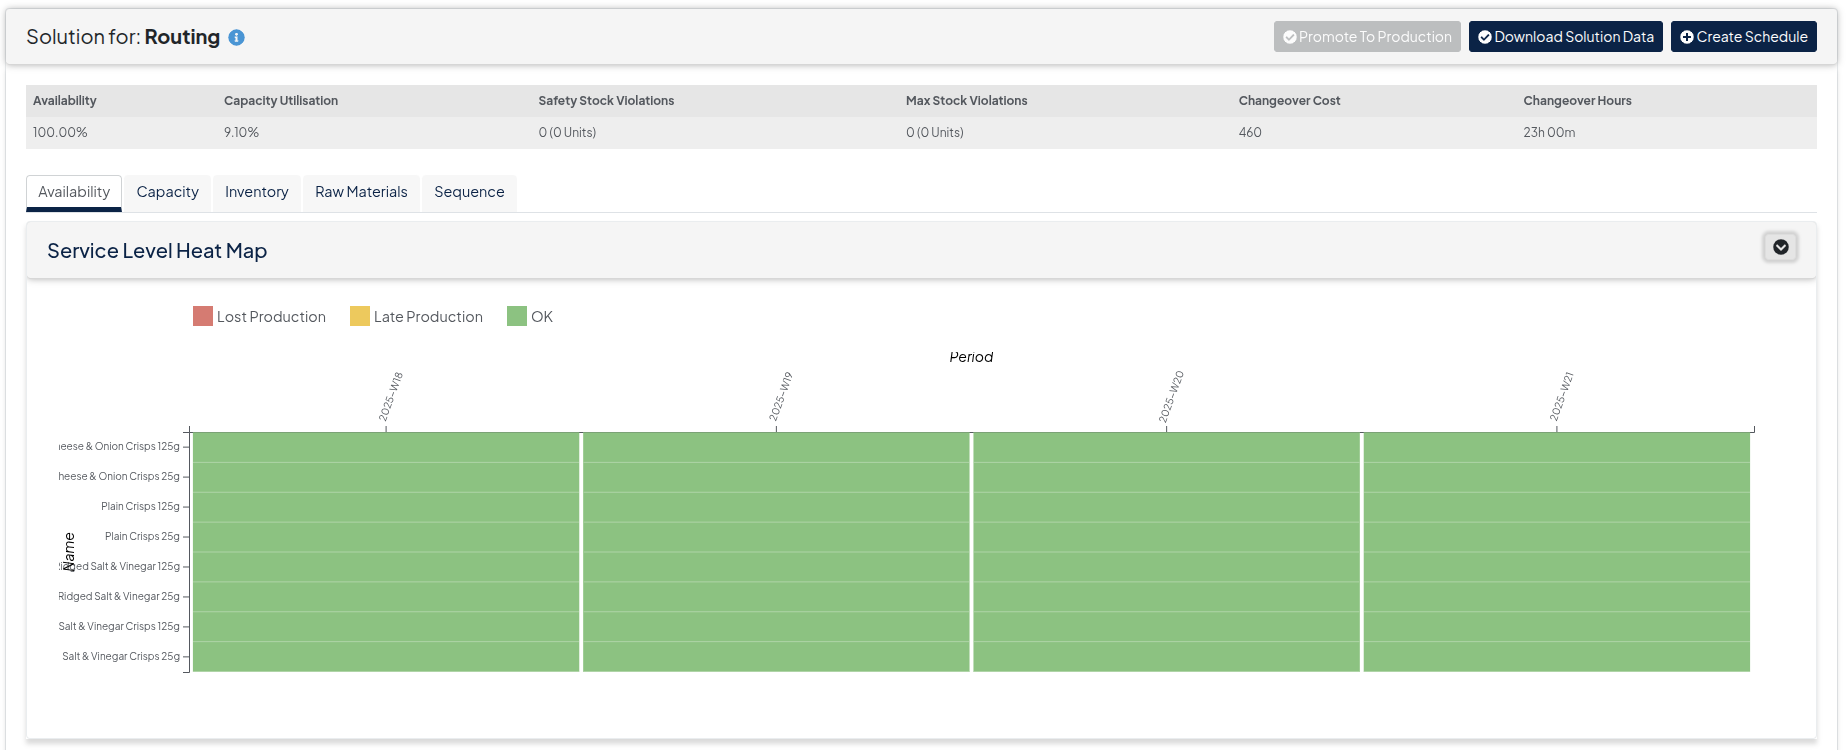
- Availability - View of forecasted demand levels being met
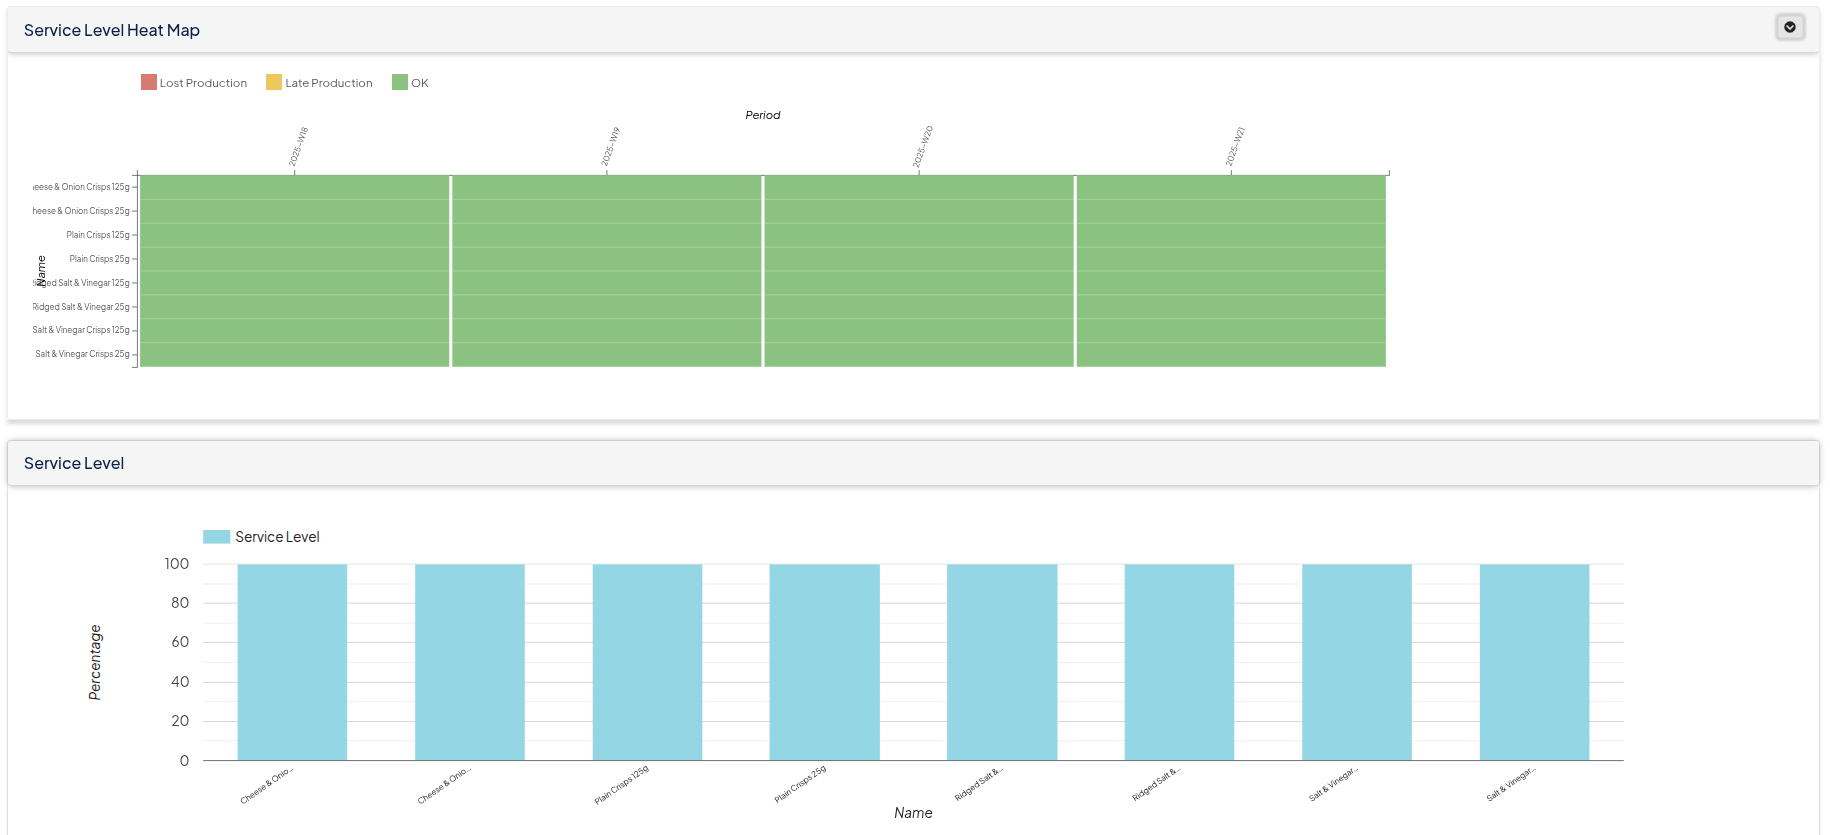
- Service Level Heat Map - To show if production levels have not met the demand forecast levels
- Service Level - To show the percentage of service levels, by group
Sevice Level Output
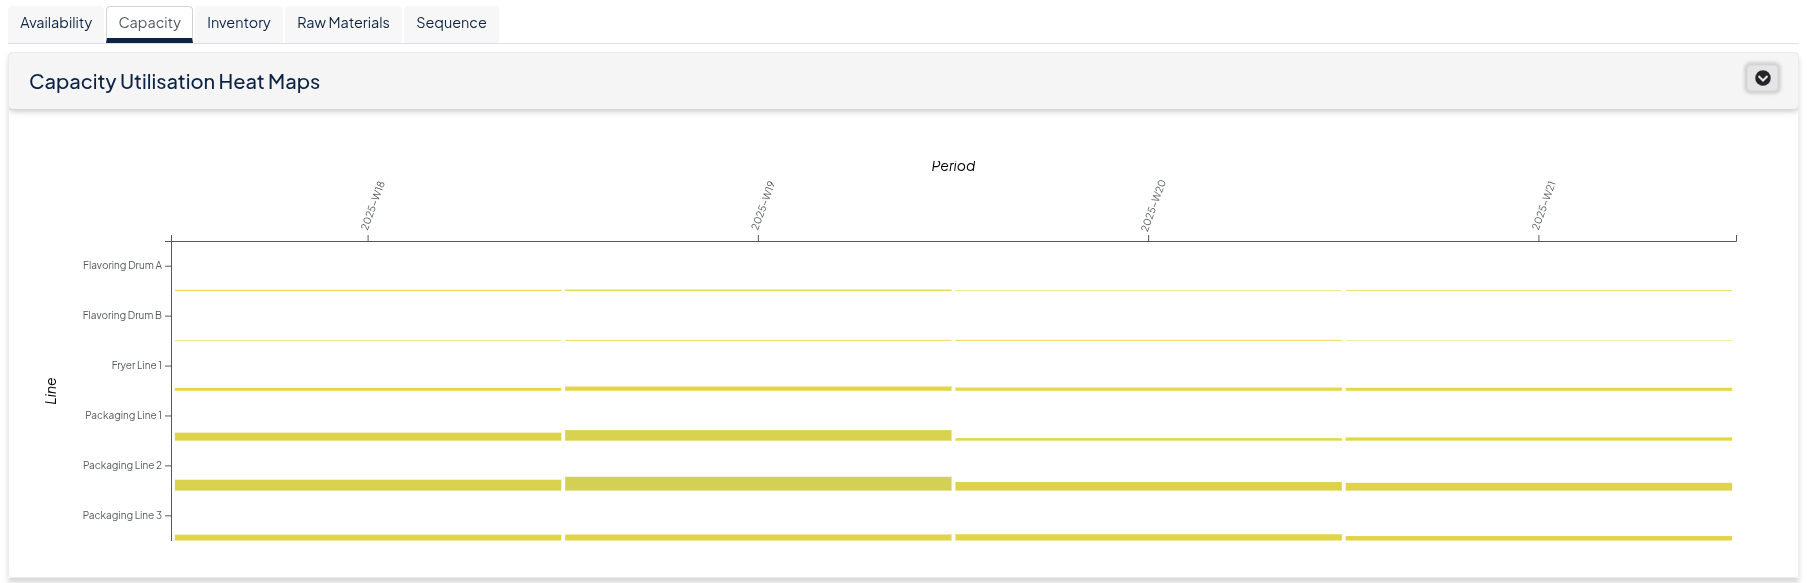
- Capacity - View of production levels
- Production Heat Map - To show when product groups are being produced over the time periods
- Line Utilisation (Filtered by Line) - To show the efficiency of which the lines were utilised for production and the cost of changeovers
Capacity Output
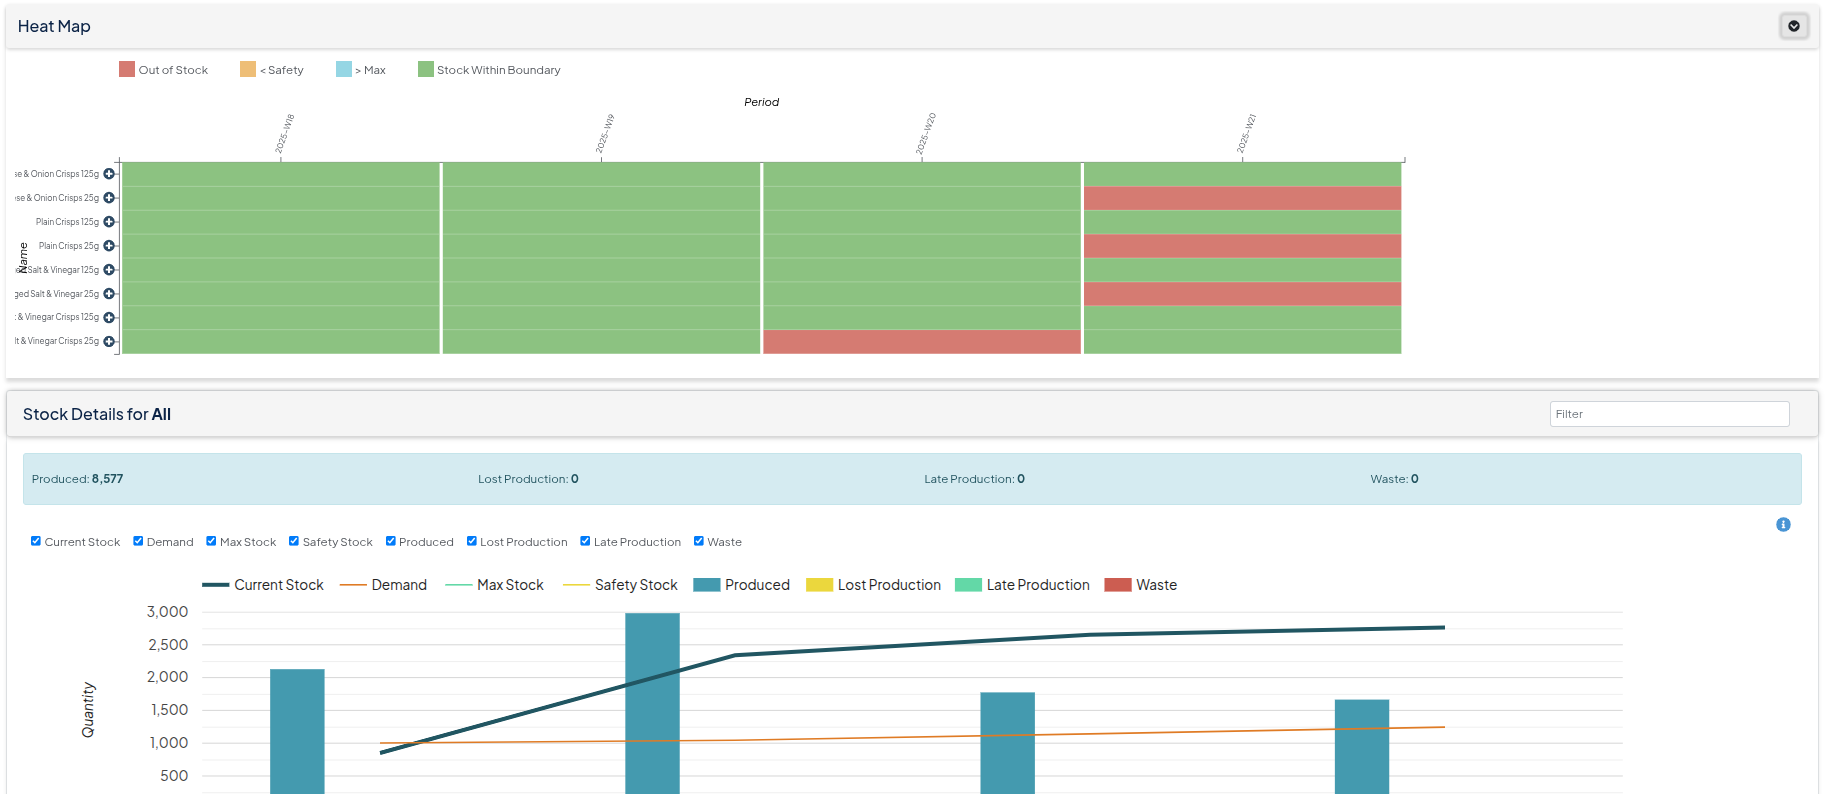
- Inventory - View of stock levels
- Stock Heat Map - When stock levels are above max stock or below safety stock
- Stock Details for Group (Filtered by Product Group) - This shows the production levels over the time periods, and overlays this information against stock levels. Metrics can be added and removed by clicking the tick box.
- Stock Violations - To show the quantity of any max stock or below stock violations
Inventory Output
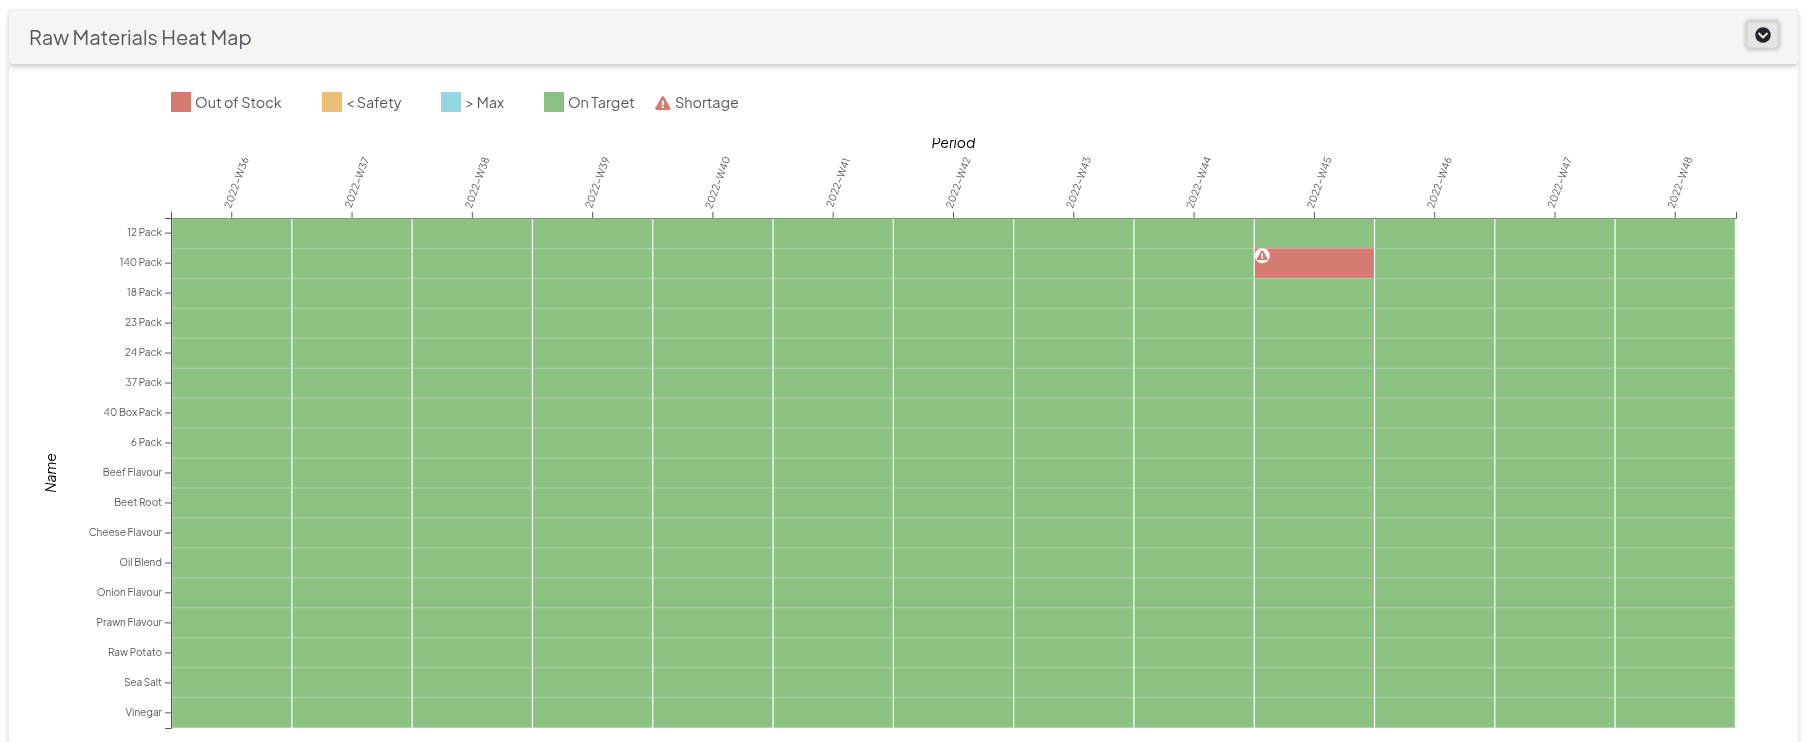
- Raw Materials - View of the raw materials over time
- Raw Material Heat Map - When raw material levels are above max stock or below safety stock or there is a shortage
- Raw Material Details (Filtered by Product) - This shows the availability levels and consumed stock over the time periods, and overlays this information against stock levels.
Raw Material Output
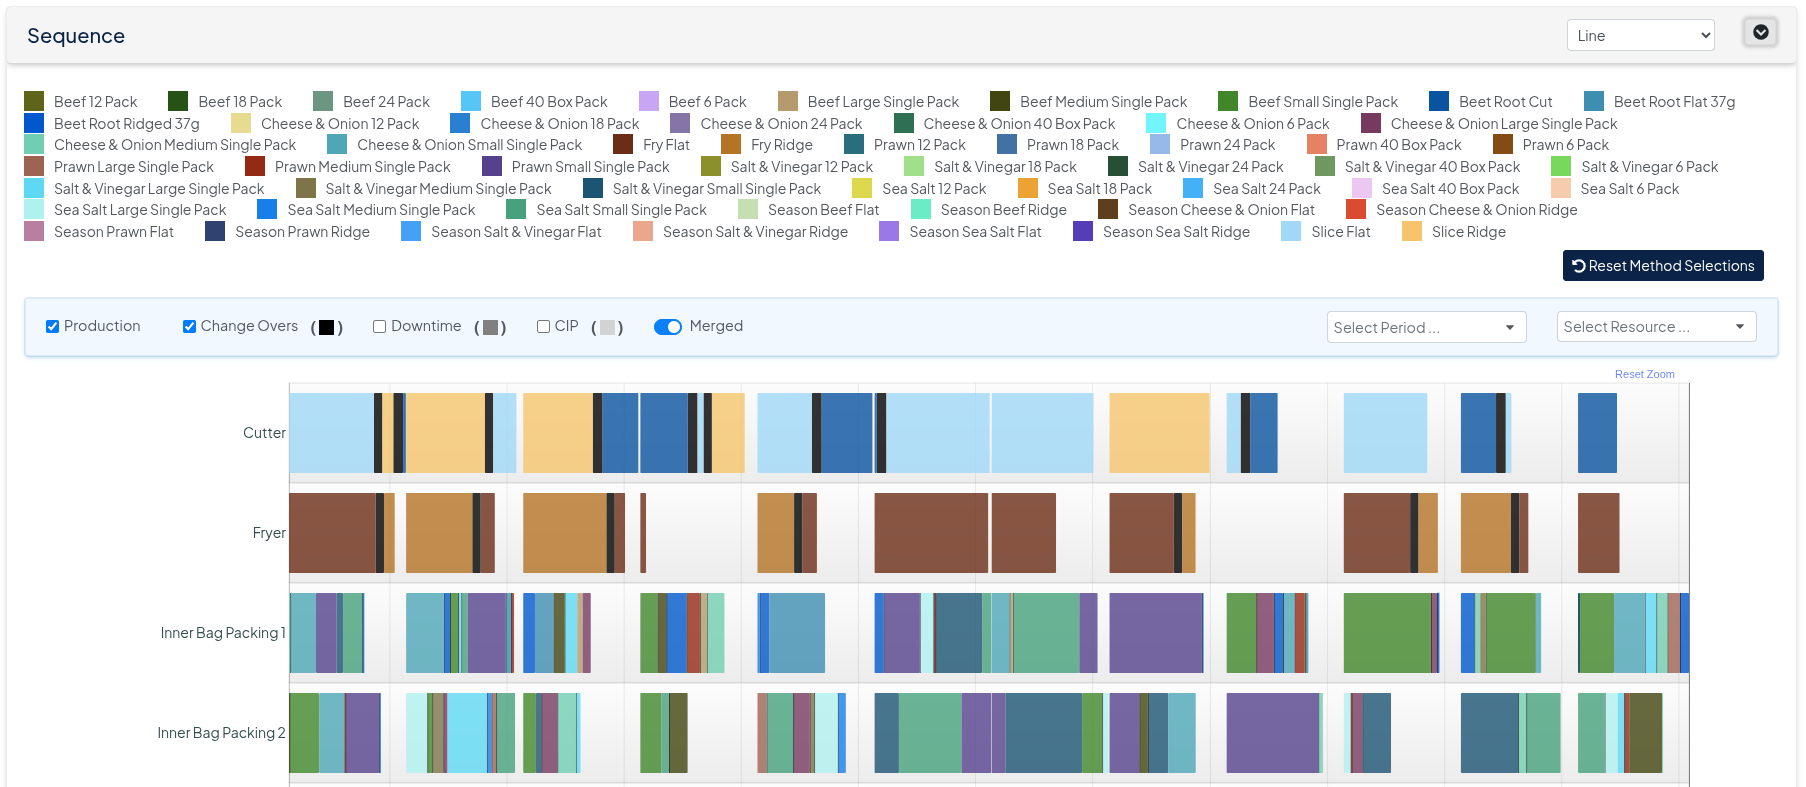
- Sequence - View of the production sequence over time
- Sequence - To show multi line production of groups, by line and by group
- Production Plan (Filtered by Line) - To show the production quantities produced over the time periods, by group
Sequence Output
Promote Solution to Production
The output for a solution can be uploaded to your production planning system by clicking the [ Promote to Production ] button.
Download Solution
From the solution page the solution output can be downloaded to an Excel file by clicking on the [ Download Solution Data ] button. The Excel output file has the following data in tabs:
- Changeover (mins) - The changeover cost in minutes, by line and time period
- Gross Production - Quantities produced in units, by Product Group and time period prior to any Yield losses (setup via Output Coefficient in Production method) taken into account.
- Gross Production per Line - The gross quantities produced in units, by Product Group, Line and time period prior to the Output Coefficient or yield losses taken into consideration.
- Net Production and Net Production per line - Both worksheet consider the impact of the output coefficient when set up for a factor below 1
- Spare Capacity (mins) - Space capacity utilisation in minutes, by line and time period
- Stock - Projected stock levels, by Product Group and time period
- Disallow Production - Indicates via a binary method that production occurs via a 1 and via a 0 that it does not occur
- Group Production Sequence - The planned sequence per line, per week quantity
- Method Production Sequence - The planned sequence per line, per week in duration. The Change Over also is reflected separately, in order to allow the user to understand how long a changeover takes
- Lost Production - In case Grace Period is indicated in the input sheet (Group properties), then in case requirements cannot be fulfilled, lost production occurs
- Late Production - In case requirements cannot be met and a grace period is activated, late production is flagged and is produced once production capacity becomes available
- Material Consumption - Required Materials needed to support the production plan per period in the indicated unit of measure as per upload